
This paper is published in the Proceedings of the 2006 Highway Geophysics - NDE conference, Saint Louis, Missouri, December 4-7 2006.
The Wyandotte County Cemetery: a case study in geophysical assessment of historic cemeteries
Geoffrey Jones
Archaeo-Physics, LLC
4150 Dight Avenue #110
Minneapolis, MN 55406
(612) 201-9333
jones@archaeophysics.com
Abstract
The Wyandotte County Cemetery, in suburban Kansas City, was in use from the mid 19th century up to 1973. It is thought to contain hundreds of recorded burials, as well as an unknown number for which no records are known. Of these, only two graves were marked, and the locations of other burials and the limits of the cemetery were not precisely known. Because of projected improvements to a roadway adjacent to the cemetery, a program of archaeological research was undertaken to define the limits of the cemetery integrating non-invasive geophysical techniques with conventional archaeological methods. The geophysical investigation consisted of electrical resistance and magnetic gradiometer surveys of portions of the cemetery. These were selected as the methods most suited to anticipated targets and local conditions, and both were successful in detecting patterning consistent with historic burial practices. In combination with archaeological testing, the geophysical survey results form the basis for an assessment of the limits of the cemetery. This investigation is illustrative of a range of issues related to geophysical assessment of cemeteries, from instrument selection and survey design to interpretation and testing.
Introduction
The Wyandotte County Cemetery is located in suburban Kansas City, Kansas. Because of plans to widen 94th Street, adjacent to the eastern edge of the cemetery, an archaeological investigation was undertaken to determine to determine the boundaries of the cemetery and assess possible impact by road construction. This investigation included both conventional archaeological methods and geophysical survey to identify burial locations and cemetery boundaries. The investigation is presented here as a case study illustrating the use of geophysical survey to map unmarked graves, issues in survey design and interpretation, and the integration of geophysical and conventional archaeological methods.
Investigation was commissioned by the Unified Government of Wyandotte County and Kansas City, Kansas. The Principal investigator was Chris Schoen of the Louis Berger Group, Inc., Marion Iowa. Geophysical survey was performed under the direction of Geoffrey Jones of Archaeo-Physics LLC, Minneapolis, Minnesota with the participation of Archaeo-Physics and Berger Personnel. Subsurface testing of geophysical survey interpretations was performed by Berger Personnel under the Direction of Mr. Schoen. Fieldwork was performed in February and March 2006. Detailed reports of the geophysical survey and archaeological investigation can be found in Jones (2006) and Schoen (2006).
Cultural and physical contexts
The Wyandotte County Cemetery was established in 1870, and was in use until 1973. It was mainly used as a burial place for indigent persons, including residents of the county poor farm, which was adjacent to the cemetery. No burial records exist for most of the period that the cemetery was in use, and the number of unrecorded burials in unknown. Records beginning 1948 document 541 interments in numbered plots during the last quarter century of its use, but of these only two are marked and the locations of the burial plots are no longer known (Schoen 2006).
The boundaries of the cemetery are not marked, except for an iron gate with short sections of chain link fence at the entrance. A steep bank sloping from the cemetery down 94th Street forms an obvious topographic boundary to the east, but it was not known whether burials were present up to the edge of the slope. In other directions, there are no features that would suggest a distinct boundary, and the property boundaries are rather distant.
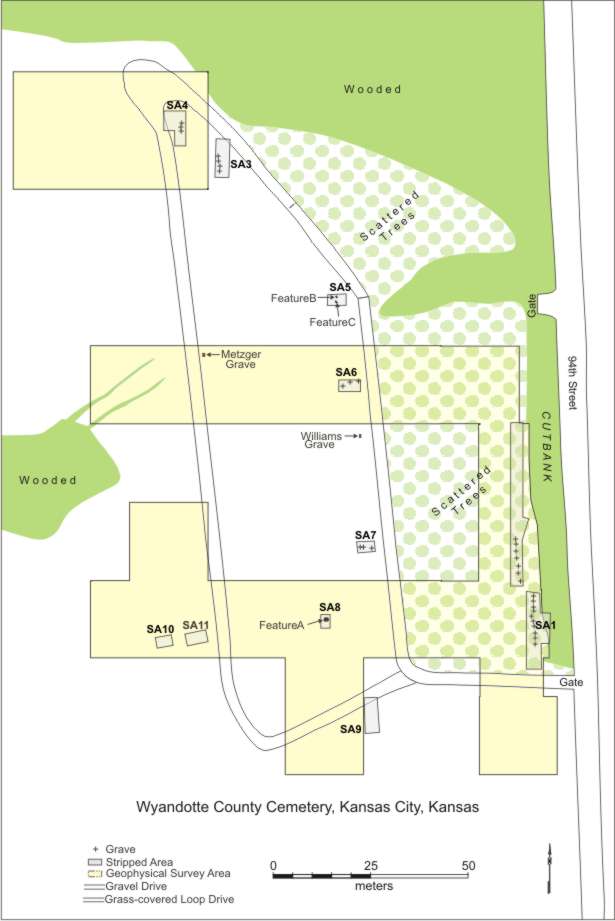
Figure 1. Wyandotte County Cemetery project area showing geophysical survey and subsurface testing areas (after Schoen 2006).
A relatively flat area of high ground adjacent to 94th Street was thought to be the oldest portion of the cemetery. A number of large trees and a monument consisting of a wooden cross on a stone and concrete monument were present in this area. A road entering the gate of the cemetery forms a loop to the west of this area. The more recent burial plots were thought to be within and perhaps surrounding the loop of the road, in the open grassy area sloping down to the west from this high ground.
Soils in the project area were observed to be silt loam to silty clay loam of aeolian origin (loess). Erosion and cultivation has resulted in relatively thin topsoil at the tops and upper slopes of landforms. Although different soil types are reported within the project area (Zavesky and Boutright (1977), they may be considered a relatively homogeneous background relative to the scale of cemetery patterning.
Methods
Magnetic field gradient and electrical resistance survey were selected as the methods most likely to detect Historic/Modern graves and other associated patterning in this setting. The use of multiple methods increases the likelihood that features will be detected, and can greatly enhance interpretability. Because each geophysical method responds to different properties, multiple data sets are complementary rather than redundant.
Although ground penetrating radar is often used to search for historic graves, it was not employed at the Wyandotte County Cemetery because local soils were unsuited to its use. Fine-grained sediments, such as the loess at the Wyandotte Cemetery, generally have a high electrical conductivity. Highly conductive soils cause excessive attenuation (conductive loss) of the GPR signal, limiting both depth of investigation and resolution (Annan and Cosway 1992). Practical experience indicates that typical archaeological features are unlikely to be detected at any depth where the conductivity is greater than 35 mS/m (although the specific value is arbitrary, it is quite conservative). The readings of the electrical resistance meter can be used to determine conductivity, which was found to exceed this threshold throughout the survey area.
The survey area was divided into a number of square or rectangular survey "grids" of varying sizes up to 30-x-30m. Each grid was surveyed by taking readings at regular intervals along regularly spaced transects. Successive transects were surveyed in a zigzag pattern until the grid was completed. The value and position of each data point was automatically recorded in digital format, and later downloaded to a portable computer.
Magnetic field gradient survey
Magnetic surveys are unsuited to many cemetery contexts because igneous rock (as monuments or occurring naturally) and ferrous metal are often ubiquitous. In the case of the Wyandotte County Cemetery, however, only two grave markers were known, and if present below the surface, these materials might be indicative of cemetery patterning.
Magnetic survey was conducted using a Geoscan Research FM256 fluxgate gradiometer at a data sample density of 8 points (each representing 4 stacked readings) per square meter. Data were collected at 0.5m transect intervals, with four samples recorded per linear meter. Anticipated magnetic survey targets included buried grave markers, steel caskets, reinforced concrete vaults, and former fences. The instrument can also detect more subtle anomalies caused by concrete or organically enriched, disturbed, or compacted soils, although these subtle anomalies are often obscured by the more intense fields associated with materials such as brick, metal, or igneous rock, and by post-depositional disturbance. The gradiometer (as opposed to single-sensor) configuration minimizes the obscuring effects of these materials, while enhancing the resolution of small, subtle features. The effective radius of response of this instrument to subtle features may be less than a meter, but objects having greater magnetic moment (such as steel caskets) may be detected at greater depth.
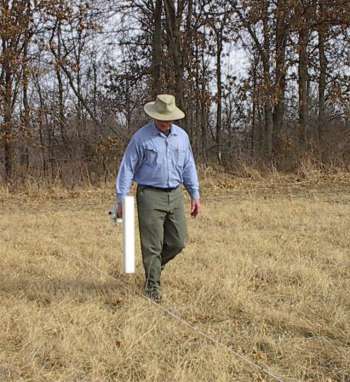
Figure 2. Magnetic survey with the FM256 fluxgate gradiometer.
Electrical resistance survey
Electrical resistance survey can be a very effective method for mapping historic cemeteries. Graves may be detectable because by the patterning of disturbed soils, or because of intrusive materials such as concrete vaults. A Geoscan Research RM15 resistance meter in twin-electrode configuration was used to perform the resistance survey. Mobile probe spacing was 0.5m. Because the depth of investigation with this probe spacing is less than one meter, graves are detected by the patterning of disturbed soils, rather than by detection of the casket, vault, or body. While a wider probe spacing will have a greater depth of investigation, it will also have lower resolution, compromising its ability to detect subtle patterning. Sample densities of either 2 or 4 samples per square meter were collected, depending on varying conditions within the survey area. After initial survey collecting data a 0.5m transect intervals, with 2 samples collected per linear meter (4 samples/m2), it was found that the transect interval could be lowered to 1m (2 samples/m2) in certain areas. This will be discussed in Data sample patterning (below).
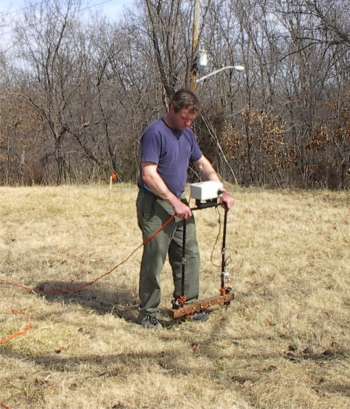
Figure 3. Survey with the RM15 electrical resistance meter.
Data sample patterning
Sampling strategy can be thought of as having two components: the selection of areas to be surveyed; and the sample density, patterning, and orientation within the surveyed areas. While some research objectives may dictate that all of a cemetery must be surveyed, other problems may be resolved by selective sampling. Data sample density determines the effective resolution of the survey as well as the rate of coverage. Sample density is therefore a compromise between time and cost and the likelihood of resolving anticipated features of interest. While lowering sample densities can reduce the per-hectare cost of survey, a survey that cannot resolve features of interest to the investigator is worthless. Also of importance is the patterning and orientation of the sampling, which can be optimized to better resolve anticipated archaeological features.
Because the goals of the investigation were limited to defining probable boundaries, complete coverage of the cemetery was not necessary, and would not have been cost-effective. The layout of the survey blocks is shown in Figure 1. The principal goal was definition the eastern boundary adjacent to 94th Street, and this was covered along its entire north-south length and for some distance beyond the apparent northern and southern boundaries. Other boundaries in the cemetery were not completely sampled, but may be reasonably interpolated based on sampling. Two 20m wide blocks were surveyed across the east-west axis of the cemetery beyond the likely western boundary. These provided a sample of apparent graves across the cemetery, and did not detect apparent graves to the west of the road loop, suggesting the road formed the western boundary. To test this hypothesis, additional blocks were surveyed along the north, south and west sides of the road loop, which failed to detect apparent graves beyond the road. While these survey blocks did not completely define the perimeter of the cemetery, terrain, vegetation, and other surface indications provide probable limits to the extent of the cemetery in areas not covered by geophysical survey.
The patterning of data samples collected with each of the instruments is described above, but some issues specific to cemetery surveys deserve further discussion. Effective resolution is dependent upon relating the geometry of sample patterning to the scale and orientation of the cemetery patterning.
It is obvious that by resolving finer detail and reducing noise higher sample density will result in higher resolution, while budgets and time constraints argue for lower sample densities. It has been the author's experience to resolve individual graves requires transect intervals of 0.5m (or less), with multiple samples collected per linear meter. It should be noted that some of the resistance survey data were collected at 1m transect intervals. It was observed that graves in the (presumed) newer portions of the cemetery were not individually resolved even at the closer transect interval, although rows of graves were faintly visible. Individual graves in these areas were readily apparent in magnetic survey results. By experimentally removing alternate lines from data collected at 0.5m transect intervals, it was determined that a 1m transect interval was effective in the "newer" portions of the cemetery, but the closer transect interval was necessary on the wooded hilltop, where patterning on the scale of individual graves could be resolved. The lowering of the transect interval in those portions of the resistance survey was also mitigated by the greater effectiveness of magnetic survey in these areas, and because these areas were of secondary priority in the goals of the survey.
Although logistical considerations often dictate that the survey grid system should be oriented with the cardinal directions (as in this case), there are sometimes compelling technical reasons why this should be avoided. Historic cemeteries are typically patterned fairly formally, with graves in north-south rows. Where the grid orientation is very close to that of cemetery patterning, several problems can arise: it can be difficult to distinguish transect-to-transect defects from cemetery patterning; the edges and precise orientation of anomalies can be obscured; and cemetery patterning may be inadvertently suppressed with some statistical filtering techniques. Although adequate sample densities and careful processing mitigate these negative effects, they are best avoided by orienting the survey grid diagonal to cemetery patterning.
Data processing and presentation
Data quality was very good, and processing was relatively straightforward. The processing steps used were fairly typical of archaeological applications of these methods. For resistance survey data these included:
- Removal of extreme statistical outliers (despike).
- "Edge matching" of grids where differences
in remote probe placement or soil moisture caused discontinuity
in data values between grids.
- Interpolation to a uniform number of data points
(4 per meter) in both the x and y directions.
- Highpass filtering to suppress large-scale variance,
lowering the standard deviation and enhancing the detectability
of small, subtle anomalies likely to be of interest.
- Lowpass filtering to suppress small scale noise
and enhance the detectability of cultural patterning.
- Clipping the data to best display cultural features.
Processing of magnetic data included:
- A zero mean traverse filter, which compensates for
defects caused by instrument drift and orientation
- (sinX/X) interpolation to a uniform number of data
points (4 per meter) in both the x and y directions
- Lowpass filtering to suppress small scale noise
and enhance the detectability of cultural patterning.
- Clipping the data to best display cultural features.
After processing and analysis using Geoscan Research Geoplot® software, resistance and magnetic data were exported to Surfer® mapping software for display as image maps.
Results and Interpretations
The following figures (4-8) show the results of the magnetic and resistance surveys presented as image maps, followed by figures showing interpretations based on both data sets. Although they are principally based on geophysical data, landscape features and historical information were also considered during the interpretive process. The interpretations given here are identical to the initial report of investigation, and are generally supported by the results of subsurface testing, discussed in Ground truthing, below.
Each of the methods was successful in mapping patterning that is consistent with the presence of graves, as well as areas that lack such patterning. There are also areas where geophysical response was ambiguous with at least one of the methods. Fortunately, the two methods respond to different phenomena, and areas of ambiguous response with one method were often readily interpretable with the other. Landscape features such as roads and topography were also considered in assessing the potential for unmarked graves.
Figures 4 and 5 show graphic plots of magnetic and resistance survey results. Figure 6 shows general interpretations based on both datasets. Figures 7 and 8 show examples of different types of anomalies within each of the datasets to illustrate the basis for geophysical interpretations.
Figure 4 (above). Magnetic survey results.
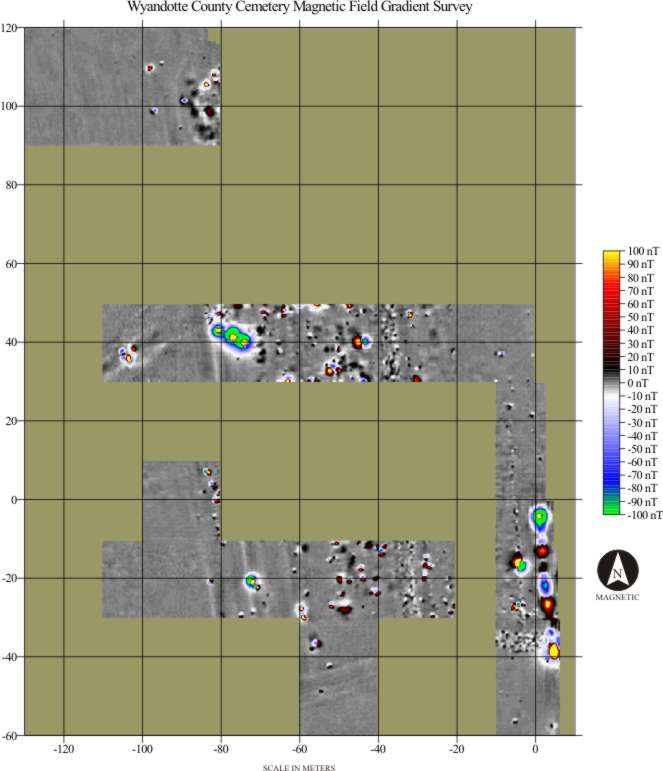
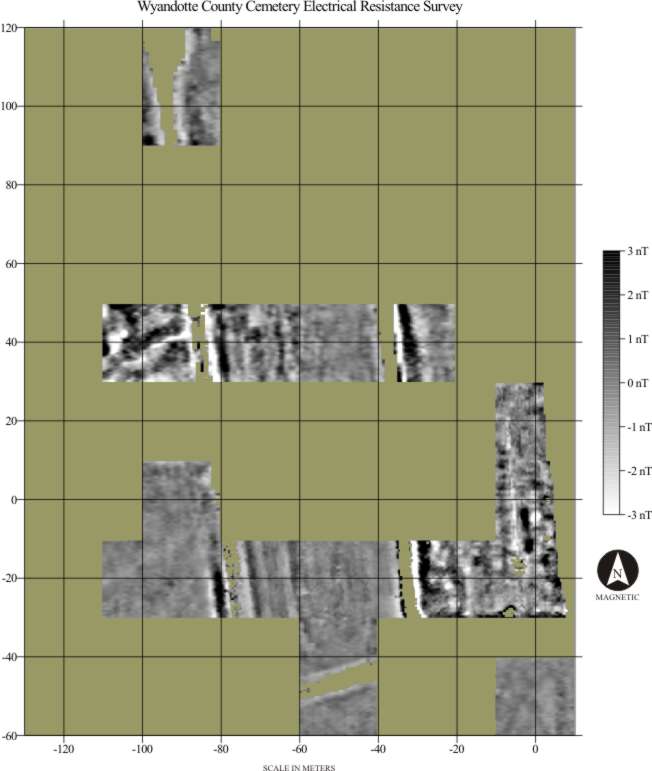
Figure 5 (above). Resistance survey results.
Figure 6 (above). Geophysical survey general interpretation
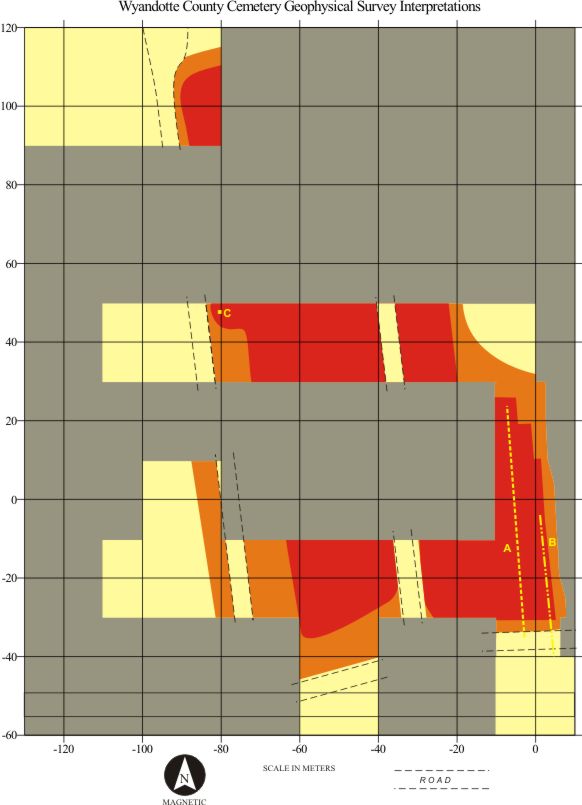
Key to interpretations (Figure 6):
- Red shading represents areas thought very likely to contain
graves. This assessment is based on patterning in either or both
data sets that is highly consistent the presence of historic/modern
graves. Throughout much of these areas, anomalies associated with
(presumed) individual graves may be observed.
- Orange shading represents areas thought moderately likely to
contain graves. Patterning within these areas is not inconsistent
with historic graves, but is ambiguous. Patterning consistent
with individual graves is not apparent. Landscaping, road construction,
and other historic/modern disturbances should be suspected as
sources of linear/rectilinear patterning.
- Pale yellow shading represents areas where the probability of
graves is considered minimal. These areas contain no patterning
that would obviously indicate the presence of graves. It must
be considered, however, that graves may be present that are not
detectable by the methods employed in this investigation.
- The linear magnetic/resistance anomaly marked A is thought to
be caused by a now-buried gravel footpath leading from the driveway
and past the cross in the wooded portion of the cemetery.
- The linear magnetic anomaly marked B may be the location of
a former fence. Although bipolar anomalies of this strength are
usually caused by masses of ferrous metal, none were found during
subsurface testing in this vicinity. Another explanation may be
remanent magnetization of soils caused by a lightning strike (Jones
and Maki 2005) on a former fence.
- A single granite headstone was exposed within the survey area at the point marked C. Anomalies caused by igneous rocks tend to be similar in appearance to those caused by ferrous metal. In this case, the anomaly caused by the headstone is obscured by the presence of other strong anomalies caused by nearby metal, mainly the wire stems of now-decayed artificial flowers.
The following figures (7 and 8) show examples of how graves and other features may be expressed geophysically. These examples were chosen to illustrate the several types of anomalies thought to be of interest. Because anomalies suspected to represent archaeological features vary in their strength and definition, grading into ambiguity, no attempt is made to interpret every anomaly. Instead, a few of the most typical anomalies of each type were selected to show the basis for the general interpretations offered in Figure 6, and to serve as a guide for ongoing interpretation.
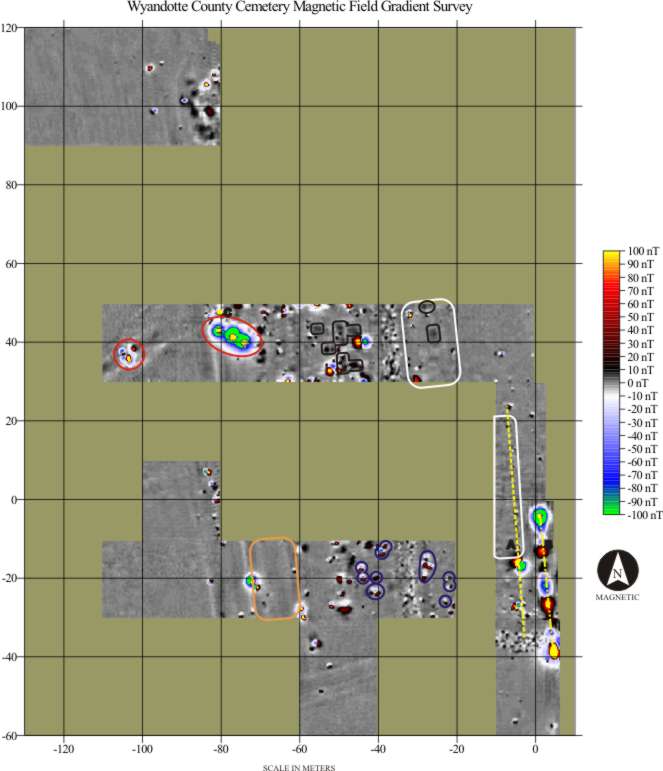
Key to interpretations (Figure 7):
- The most unambiguous evidence for burials in the magnetic survey
results are discrete magnetic highs with rectilinear patterning.
Several examples of this type of anomaly are outlined with black
lines. The strength of these anomalies is moderate, generally
10nT or less, and they lack a visible negative component. This
is consistent with a strongly magnetic source (such as ferrous
metal, granite, or brick) at a relatively great depth. Their patterning,
oriented with the cardinal directions, is consistent with Euro-American
burial practices. Presumed sources are vaults or metal caskets.
This type of anomaly may be interspersed with more subtle effects
from disturbed soils, or obscured by stronger effects from near-surface
phenomena (see below).
- Areas outlined in white indicate examples of subtler patterning
thought to be caused by disturbed soils. Disturbed soils may appear
as either magnetic highs or lows, or may appear less homogeneous
than undisturbed areas. In general, these effects are very weak,
and may be indistinct, but their patterning may be visible in
larger, magnetically quiet areas.
- An area outlined in orange shows larger-scale patterning that
is evidently associated with the cemetery, but lacks small-scale
patterning on the scale of individual graves or rows of graves.
This type of patterning may be caused by landscaping or other
earth-moving and does not specifically indicate graves, although
they may be present. Similar pattering elsewhere is clearly associated
with roads.
- Examples of small but relatively strong bipolar anomalies are
circled in blue. This type of anomaly is caused by materials with
strong magnetic remanence (e.g., ferrous metal, granite, or brick)
at or near the surface. Sources that would be of interest would
include granite grave markers, the metal stems from plastic flowers,
or corner irons marking cemetery plots. The patterning of metal
debris or other anomaly sources not directly associated with graves
may indicate areas of general activity, and may be indirect evidence
of cemetery use. In general, a more diffuse appearance indicates
a greater relative depth. Deeper sources also tend to show less
of a positive component, and examples may be seen grading into
diffuse magnetic highs similar to those outlined in black. Road
gravels can be seen as concentrations of very small and weak anomalies
of this type.
- Two examples of very strong bipolar fields are circled in red.
These examples are almost certainly caused by large masses of
ferrous metal, although large masses of igneous rock or lightning
strikes may cause very strong anomalies as well.
- now-buried gravel footpath leading from the driveway and past
the cross in the wooded portion of the cemetery.
- The linear magnetic anomaly marked B may be the location of a former fence. Although bipolar anomalies of this strength are usually caused by masses of ferrous metal, none were found during subsurface testing in this vicinity. Another explanation may be remanent magnetization of soils caused by a lightning strike (Jones and Maki 2005) on a former fence.
- A single granite headstone was exposed within the survey area at the point marked C. Anomalies caused by igneous rocks tend to be similar in appearance to those caused by ferrous metal. In this case, the anomaly caused by the headstone is obscured by the presence of other strong anomalies caused by nearby metal, mainly the wire stems of now-decayed artificial flowers.
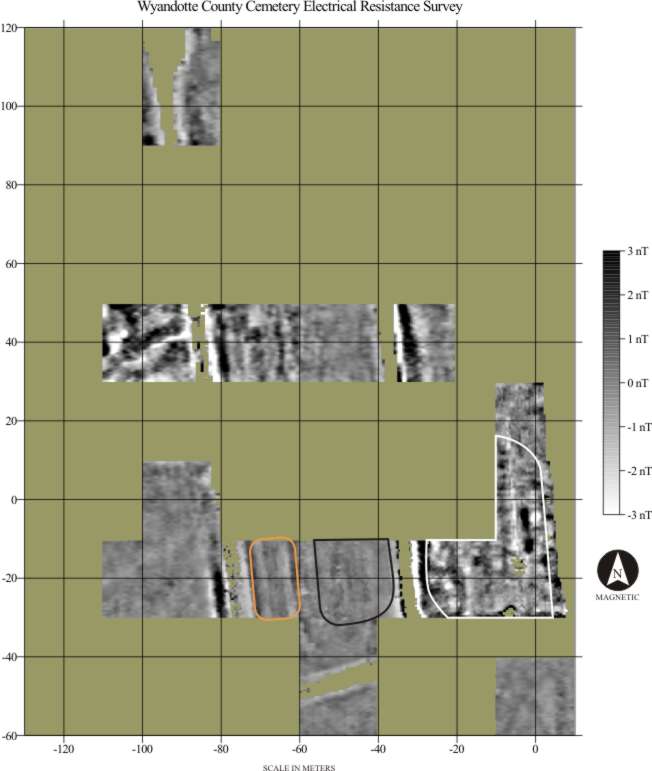
Figure 8 (above). Examples of resistance anomalies.
Key to interpretations (Figure 8):
- The area outlined in white contains the clearest evidence of
graves in the resistance survey data. The boundaries of this area
are roughly the same as the flat hilltop, which is the highest
ground within the cemetery. This area is thought to be the oldest
part of the cemetery. A number of large trees were present in
this area. Typically, trees tend to obscure subtle features, both
because of the roots themselves and because of differential moisture
uptake. In spite of the trees, apparently cultural features appear
most clearly and with greatest contrast in this area. The anomaly
indicated by a dashed white line is thought to be a footpath,
not apparent on the surface, going from the driveway past the
wooden cross.
- The area outlined in black is an example of patterning that
is more typical of areas thought to contain graves. Although there
is good evidence from the magnetic survey for graves in this area,
patterning in the resistance survey is subtle to the point of
ambiguity. While there is patterning consistent with rows of graves,
individual graves are not defined and boundaries are indistinct.
This type of patterning is typical of what is thought to be the
most modern use of the cemetery (mid 20th century), generally
comprising the area within the loop of the roads. Fortunately,
magnetic survey results from this area are much more interpretable.
The differences in the resolution of apparent graves between this
example and the one previous (outlined in white) may be due to
a number of factors, including burial practices and differences
in terrain and geology.
- An area outlined in orange shows larger-scale patterning that
is evidently associated with the cemetery, but lacks small-scale
patterning on the scale of individual graves or rows of graves.
This type of patterning may be caused by landscaping or other
earth-moving and does not specifically indicate graves, although
they may be present. Similar pattering elsewhere is clearly associated
with roads.
- An area outlined in green contains patterning that is not inconsistent
with a row of graves, although it is thought most likely to be
associated with the adjacent road.
- The area outlined in red shows variance associated with drainage features, and is not considered likely to contain graves.
In summary, it may be said that while there is some degree of ambiguity, the preponderance of geophysical and landscape evidence suggests that the cemetery was limited to the interior of the road loop, and to the flat hilltop between the road loop and 94th Street. Strong evidence for graves in the geophysical survey results is limited these relatively discrete areas. The area within the loop formed by the gravel/dirt roads within the cemetery appears to contain a high density of graves, although some patterning is poorly defined, and some may express an area that that has been landscaped but contains no burials. The other area thought to contain burials lies on the high ground between the easternmost road within the cemetery and 94th Street. It is bounded on the south by the gravel road that leads through the gate, and by sloping ground to the north and east. Outside of these areas, some anomalies of potential interest occur, but these are thought more likely to be associated with grading of the adjacent road (Figure 8, outlined in green).
Ground truthing
While invasive testing is often precluded from cemetery studies, ground truthing can greatly inform the interpretation of geophysical data. Initial interpretations based on geophysical results should be considered hypotheses. Subsurface testing (if it is to be performed) should be directed towards testing initial hypotheses. Fortunately, the patterning of historic Euro-American cemeteries tends to be very distinctive, and may sometimes be confidently interpreted without invasive testing.
Subsequent to the geophysical investigation, interpretations were tested by stripping selected areas with a backhoe to expose subsurface evidence of graves. Eleven areas were tested, representing zones thought unlikely to contain graves, as well as those containing geophysical patterning suggesting burials. Four of the areas tested were outside of the geophysical survey area, providing some degree of testing of interpolation/extrapolation of survey results. Stripped areas and confirmed burials are shown in Figure 1.
In the eleven stripped areas, 31 burials were identified, as well as several indeterminate and non-grave features. In general, the depth to burials was found to be three to four feet. Graves within the older (eastern) portion of the cemetery were found to contain shroud burials, while those in the newer portion contained wooden coffins. No vaults or steel caskets were found during testing, although some anomalies suggest that these may be present elsewhere (see Figure 7 interpretations, above). All of the graves identified during ground truthing were within the posited limits of the cemetery (the interior of the road loop, and to the flat hilltop between the road loop and 94th Street), and showed good correlation between geophysical patterning and verified burials.
For a detailed discussion of ground truthing procedures, results, and interpretations, see Schoen (2006).
Summary
Appropriately applied, geophysical methods can be an effective tool for subsurface mapping of cemeteries. Ideally, geophysical methods should be part of an integrated program of research that considers historical, archaeological, environmental, and other available data. Instrumentation, sampling strategy, and other survey design parameters must be adapted to unique site conditions and specific research goals.
Magnetic and resistance survey were both successful in detecting patterning that is clearly associated with graves, but with each of these methods there are areas of ambiguous response where there is patterning suggestive of graves, but weak or poorly defined. Fortunately, areas that are ambiguous in one dataset tend to have well-defined patterning in the other. Resistance survey provided better resolution of graves in the older part of the cemetery, while magnetic survey responded better to graves in the newer part of the cemetery. This illustrates the value of using multiple geophysical methods, especially where burial practices or other conditions may vary within the cemetery. The unsuitability of GPR to the soils at the site shows the importance of pre-survey reconnaissance as well as underscoring the danger of reliance upon a single geophysical method.
Interpretation of geophysical data should integrate other available sources of data in generating initial interpretations. Where ground truthing may be performed, interpretation becomes an iterative process o f hypothesis generation, testing, and refinement of initial interpretations. In the case of the present study, initial interpretations were broadly confirmed by ground truthing results, resulting in greater confidence without fundamental revision.
References Cited
Annan A.P. and Cosway S.W., 1992, Ground Penetrating Radar Survey Design: Paper Prepared for the Annual Meeting of SAGEEP, April 26-29, Chicago, Illinois.
Jones, Geoffrey, 2006, Geophysical survey of the Wyandotte County Cemetery, Kansas City, Kansas: Archaeo-Physics Report of Investigation Number 102. Submitted to The Louis Berger Group, Marion Iowa by Archaeo-Physics, LLC Minneapolis, MN.
Jones, Geoffrey, David L. Maki, 2005, Lightning-induced magnetic anomalies on archaeological sites: Archaeological Prospection, Volume 12, Issue 3, 2005. Pages 191-197.
Schoen, Christopher M. 2006, Phase II Archaeological Investigation Of The Wyandotte County Cemetery: Submitted to Public Works Department, Unified Government of Wyandotte County and Kansas City, Kansas by The Louis Berger Group, Inc. Marion, Iowa.
Zavesky, Larry D., and William C. Boutright, 1977, Soil Survey of Leavenworth and Wyandotte Counties, Kansas: United States Department of Agriculture, Soil Conservation Service and the Kansas Agricultural Experimental Station, Washington, D.C.
Related Content:
Case Study: The Wyandotte County
Cemetery